Cabinet ministers - 1990:2014
Document History
Original Publish Date: 15 January, 2021
Updated on: 13 February, 2021
Data summary
This data set on cabinet minsters in India from the year 1990-2014 provides us information on their party, appointment duration, ministry, rank, gender, caste and reservations and dynast status. This data set has 1499 observations and 22 variables.
For more info on the data please refer to the codebook - codebook
Main variables in the data
##  [1] "year"              "ls_number"         "ac_id"
##  [4] "name"              "party"             "gender"
##  [7] "caste"             "portfolio"         "rank"
## [10] "appointment_begin" "appointment_end"   "house"
## [13] "constituency"      "pid"               "State"
## [16] "start_source"      "end_source"        "comments"
## [19] "type_begin"        "type_end"          "dyn"
## [22] "comments.1"
Sample data
Distribution
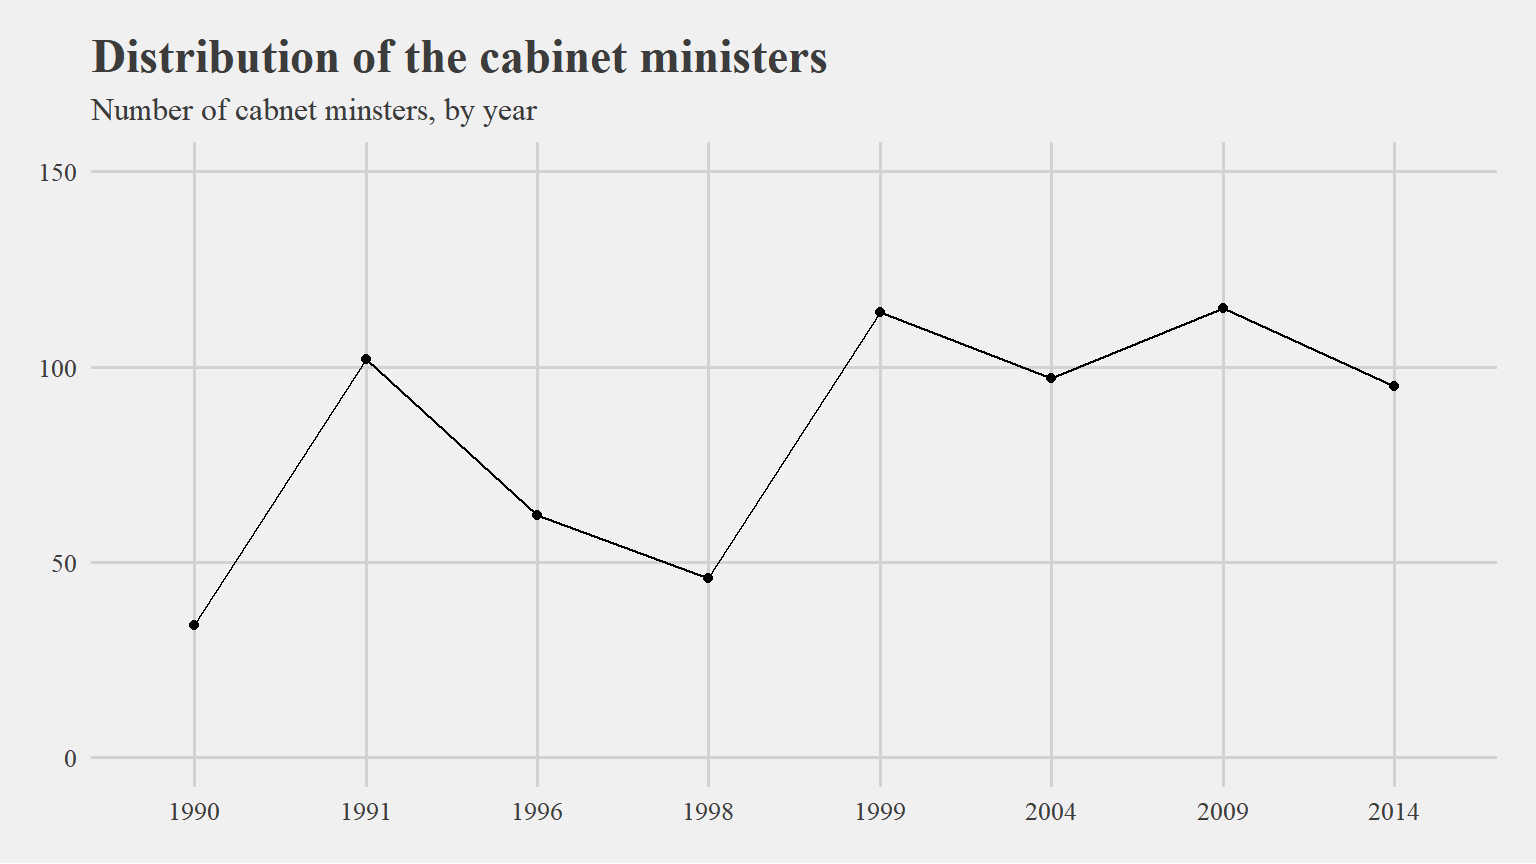
All ministers*
The ministers are chosen from both Loksabha and Rajyasabha. This graphs shows us the distribution of the minsters with regards to the house across the years.
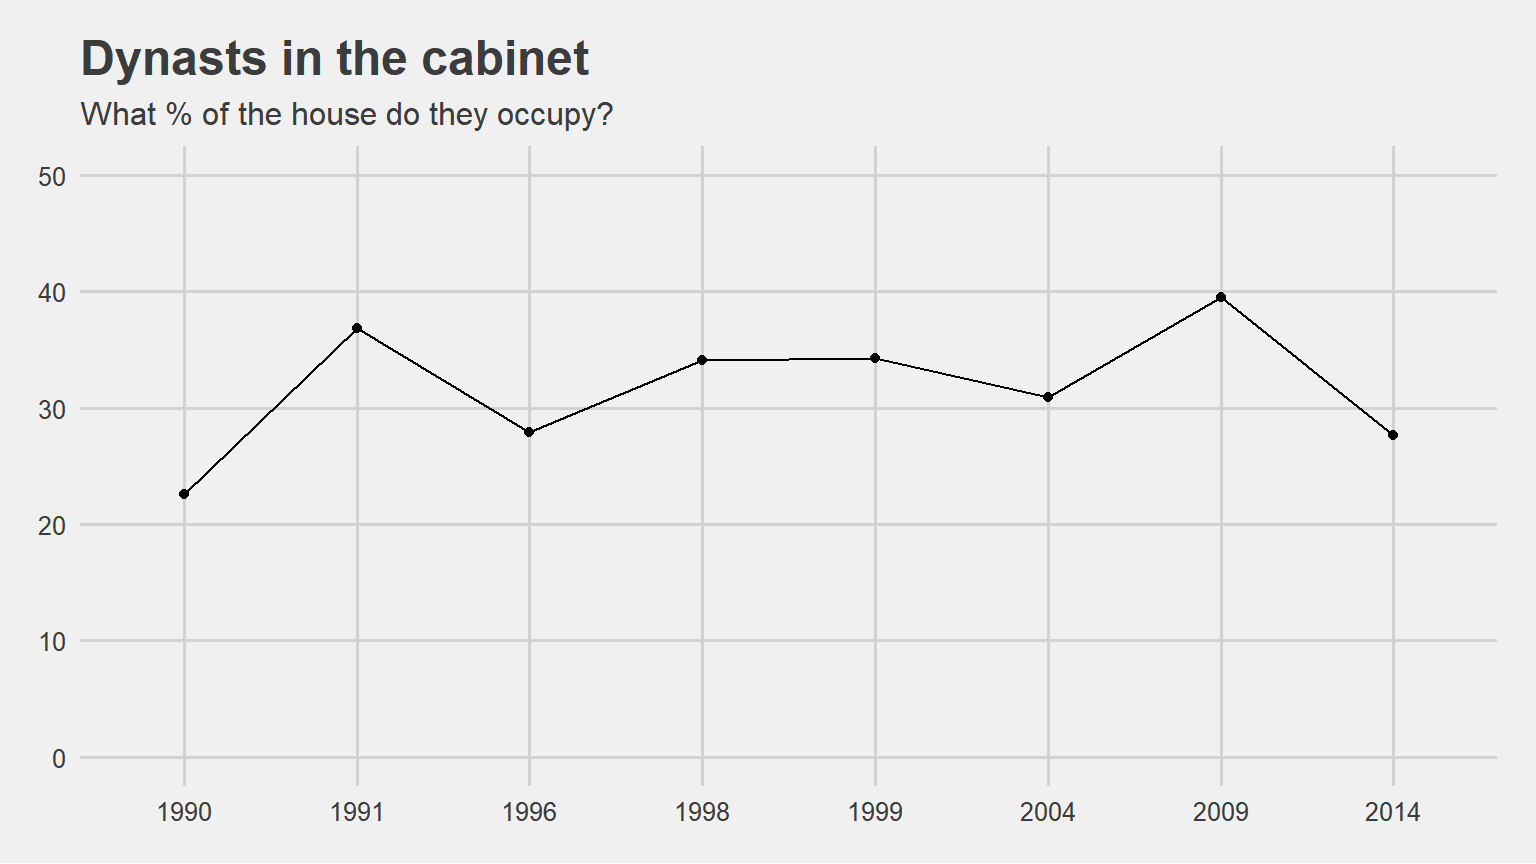
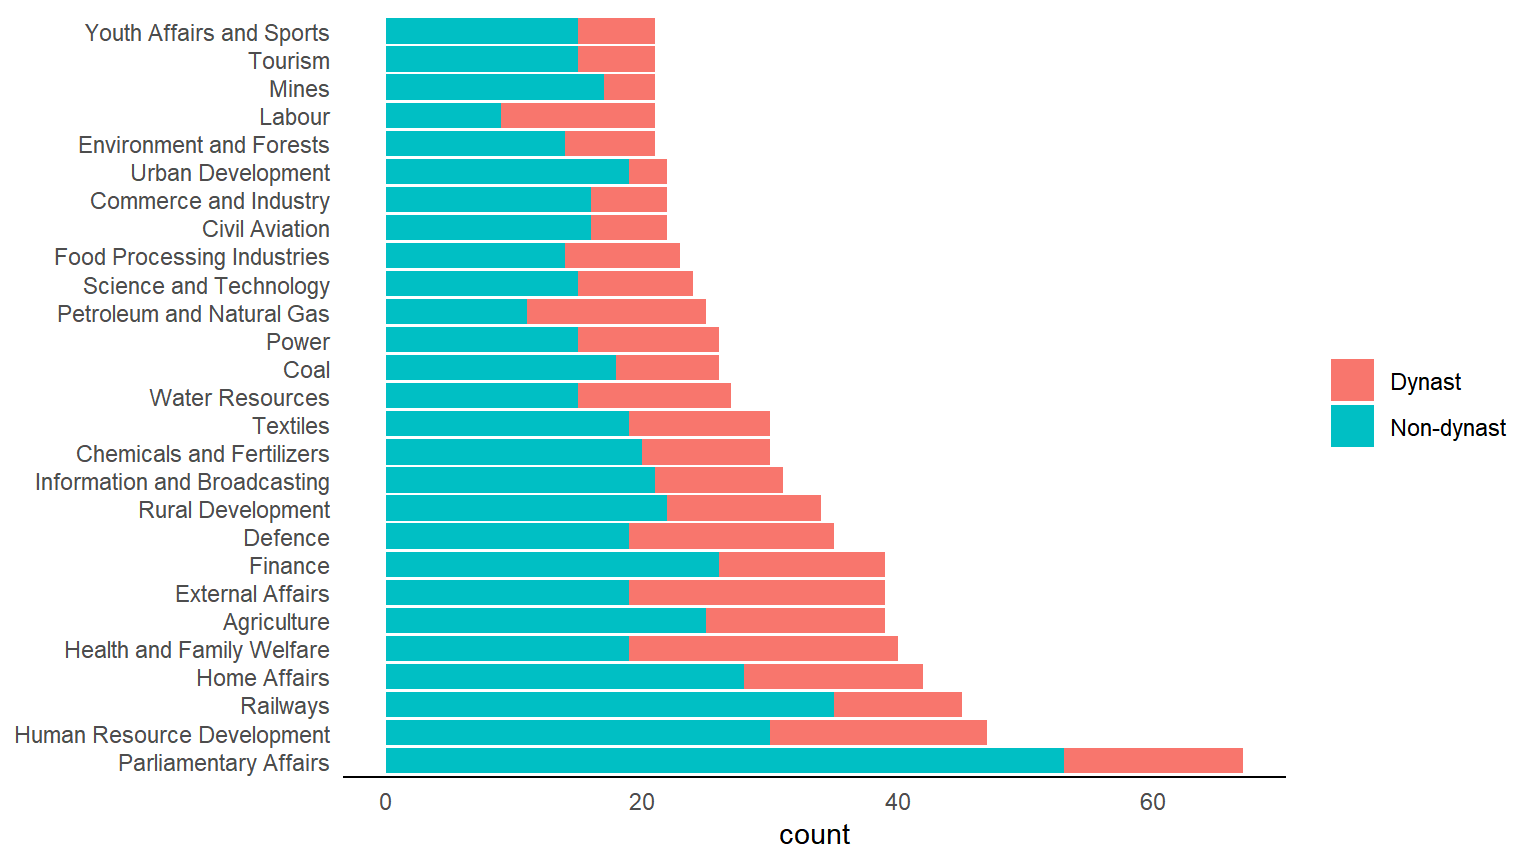
Dynasts
This bar plot shows us the proportion of dynast minsters from both the houses for each cabinet.
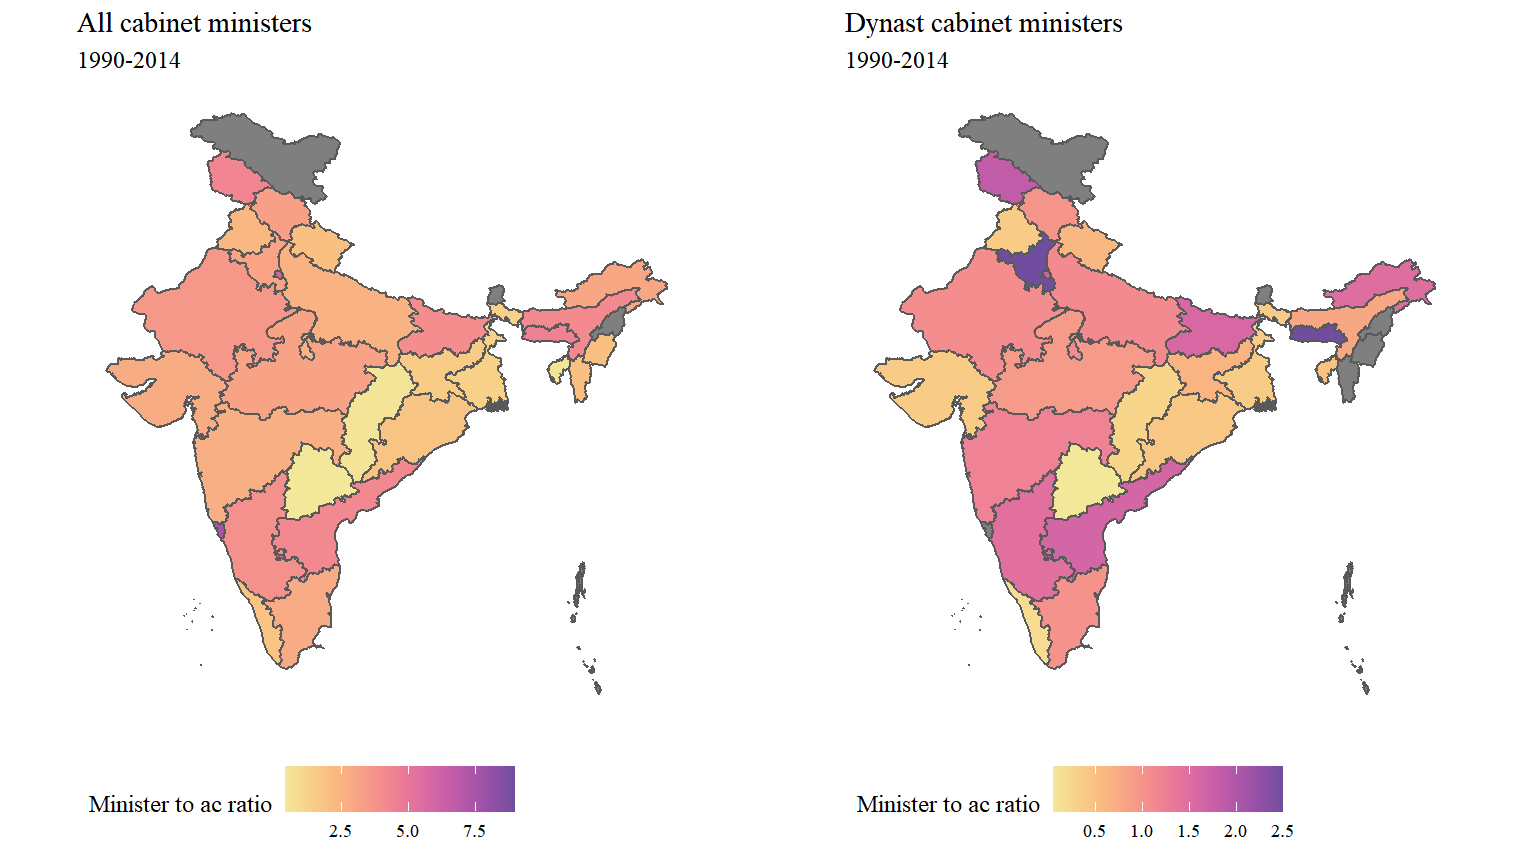
States
The following maps tell us the proportion of the minsters from each state.
In order to find the proportion of the ministers from each state, we created a variable named Minister to ac ratio which is the ratio of number of ministers from that state to the number of Parliamentary constituencies in that state. States in grey colour are the states which never had minsters during the period of 1990-2014.
Term & Duration
This table shows the number of minsters/number of terms,number of unique minsters, total term and average term per person/uniq person for both the dynast and non-dynast ministers.
House | dynastast | N_ministers | uniq_ministers | Total term (months) | Average term per min | Average term per uniq_min |
|---|---|---|---|---|---|---|
Lok Sabha | Dynast | 402 | 137 | 8309.06 | 20.67 | 60.65 |
Lok Sabha | Non-dynast | 655 | 256 | 13474.96 | 20.57 | 52.64 |
Rajya Sabha | Dynast | 119 | 36 | 1724.47 | 14.49 | 47.90 |
Rajya Sabha | Non-dynast | 280 | 103 | 5625.56 | 20.09 | 54.62 |
Rank
rank | dynast_percentage |
|---|---|
CM | 47.75 |
DM | 26.67 |
MoS | 23.58 |
MoS(IC) | 26.52 |
PM | 33.33 |
Portfolio
Top ministries
We have around 118 ministries now, we can reduce it further with some cleaning. Do we need a further analysis based on the ministries? this will enable us to address question like what kind of ministries do dynasts prefer . If so, we we can go ahead with further cleaning.
Eg: we can club coal/mine/petroleum to one natural resources category